Luxury Housing Market Loses Spring Momentum | Living In Phoenix Arizona
LUXURY HOUSING MARKET LOSES SPRING MOMENTUM
LIVING IN PHOENIX, ARIZONA
Luxury Housing Market Loses Spring Momentum
The luxury housing market tapped the brakes in April. Financial volatility led both buyers and sellers at the high end to hit pause, according to Zillow’s latest look at the luxury housing market.
The typical luxury home — defined as the top 5% most valuable homes in each region — is now worth about $1.8 million nationwide, and more than double that in six major metros: San Jose, Los Angeles, San Francisco, Miami, San Diego and New York. These homes typically encompass nearly 3,500 square feet of living space and are often situated on more than two-thirds of an acre. Despite the recent slowdown in total market activity, luxury home values have increased 2.7% over the past year, outpacing the 1.4% growth seen in the broader market.
“Despite a slower market, home prices have continued to climb — a promising sign for sellers considering listing their properties. Luxury home values, in particular, have remained resilient, even as both buyers and sellers took a more cautious approach after the April stock market volatility,” said Zillow Senior Economist Orphe Divounguy. “The luxury market is often international, so global economic conditions and stability also play a significant role. As economic conditions begin to stabilize, the luxury housing market could regain some momentum.”
Affordability challenges — including high mortgage rates, elevated home prices and ongoing macroeconomic uncertainty — have made many people hesitant to enter the market. While luxury buyers often have substantial equity and cash reserves, they still are proceeding with caution. However, the limited supply of high-end homes and their desirable features continue to keep home values ticking higher, even in a more subdued market.
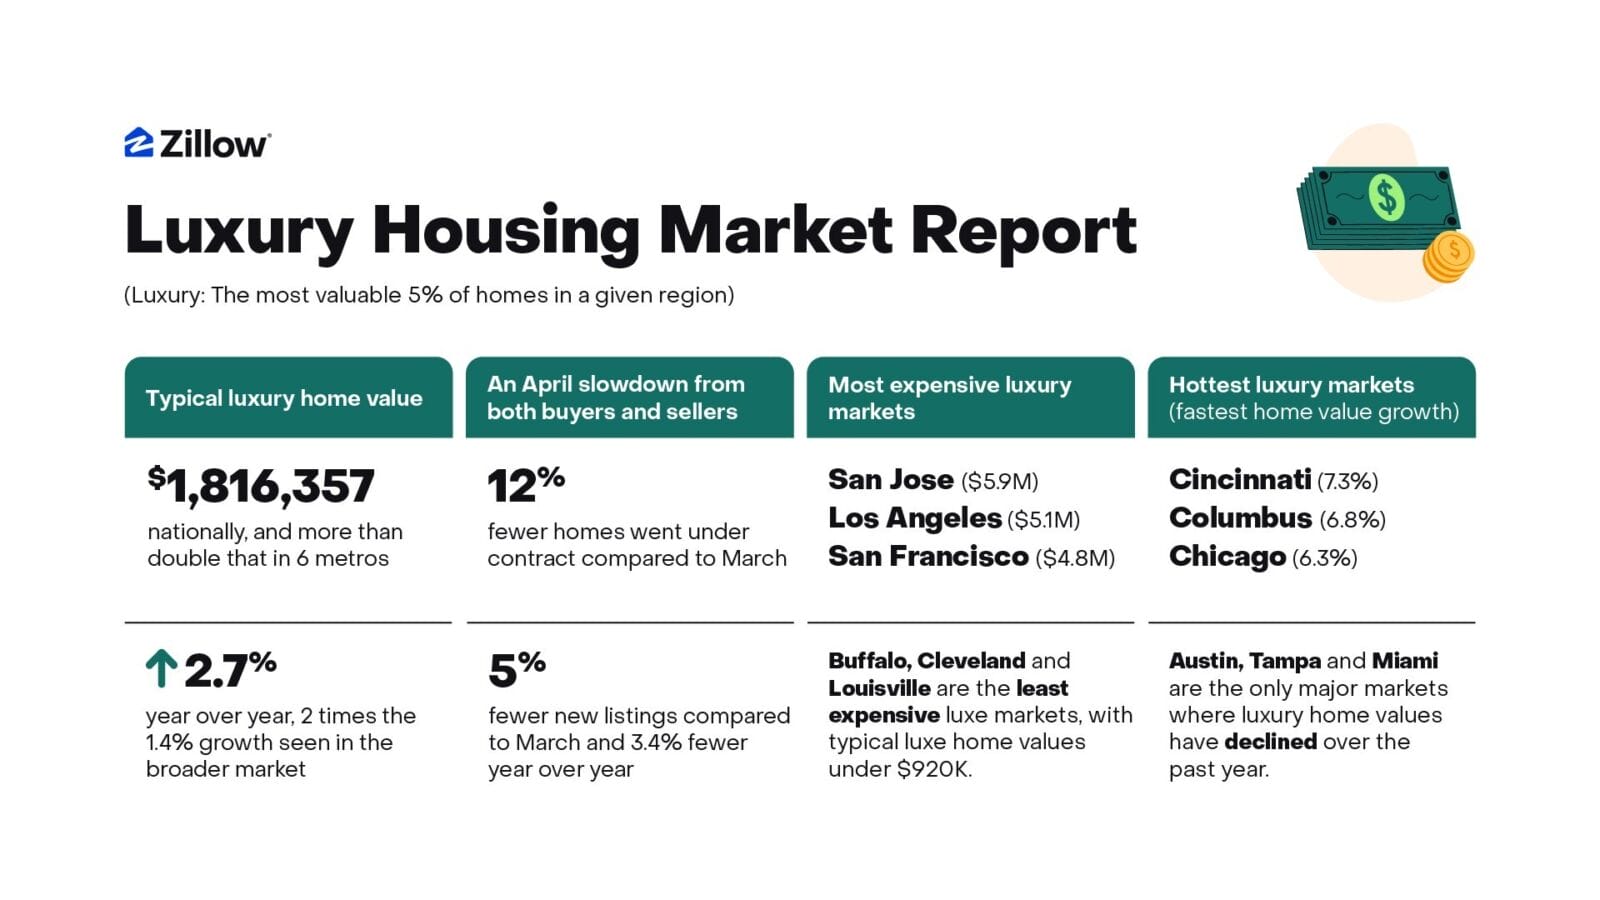
Early spring brought a burst of activity: From February to March, the number of luxury homes that went under contract went up by more than 30%. But in April, that momentum faded as consumer confidence and investment portfolios dipped. In April, 12% fewer luxury homes went under contract compared to March — a dramatic drop since sales usually pick up in the spring. By comparison, last April, 10% more luxury homes went under contract from the previous month. Sellers also pulled back, with new luxury listings down 5% from March and down 3.4% year over year.
Among the 50 largest U.S. metro areas, typical luxury home values range from just over $835,000 in Buffalo to nearly $6 million in San Jose. California dominates the top of the luxury market, with San Jose ($5.9 million), Los Angeles ($5.1 million) and San Francisco ($4.8 million) ranking as the three most expensive metros for luxury homes.
The hottest luxury markets, where home value growth has surged the most annually, include Cincinnati (7.3%), Columbus (6.8%), Chicago (6.3%), Cleveland (6.1%) and Las Vegas (6.1%). Conversely, Austin (-2.1%), Tampa (-1.7%) and Miami (-0.5%) are the only major markets where luxury home values have declined over the past year. As for where homes are flying off the market, Ohio is front and center. In Cincinnati and Columbus, luxury homes are typically going under contract after just five days.
Nationwide, the typical luxury home is valued at about five times the price of a mid-market home. In 2020, luxury homes were worth nearly 5.5 times as much. This indicates that the price gap between luxury and typical homes has narrowed over time.
| Metro Area* | Typical Luxury Home Value |
Luxury Home Value Change (YoY) |
Share of Luxury Listings with a Price Cut |
Luxury Homes, Median Days to Pending |
Luxury Homes, Inventory Change (YoY) |
Luxury Homes, New Listings Change (YoY) |
Luxury Homes, Newly Pending Listings Change (YoY) |
| United States | $1,816,357 | 2.7 % | 19.9 % | 20 | 0.9 % | -3.4 % | -17.2 % |
| New York, NY | $3,976,247 | 4.7 % | 11.7 % | 37 | -14.3 % | -15.2 % | -18.3 % |
| Los Angeles, CA | $5,127,335 | 1.3 % | 18.4 % | 29 | 30.8 % | 14.2 % | -13.8 % |
| Chicago, IL | $1,484,177 | 6.3 % | 18.4 % | 9 | -25.6 % | -22.6 % | -18.0 % |
| Dallas, TX | $1,848,826 | 2.8 % | 24.5 % | 18 | 15.2 % | 6.8 % | -9.1 % |
| Houston, TX | $1,601,027 | 4.6 % | 23.0 % | 16 | 4.3 % | 6.2 % | -19.4 % |
| Washington, DC | $2,271,449 | 3.8 % | 24.2 % | 9 | 9.8 % | 3.7 % | -21.4 % |
| Philadelphia, PA | $1,415,836 | 3.5 % | 15.4 % | 7 | -10.6 % | -11.2 % | -15.7 % |
| Miami, FL | $4,552,407 | -0.5 % | 17.5 % | 82 | -0.6 % | -11.9 % | -29.0 % |
| Atlanta, GA | $1,574,667 | 2.8 % | 19.9 % | 19 | 11.2 % | 11.8 % | -8.5 % |
| Boston, MA | $3,033,002 | 5.1 % | 17.1 % | 12 | 3.9 % | 12.6 % | -9.4 % |
| Phoenix, AZ | $2,282,646 | 3.7 % | 33.6 % | 33 | 7.7 % | -9.9 % | -20.8 % |
| San Francisco, CA | $4,833,421 | 2.0 % | 17.4 % | 13 | 5.0 % | 0.7 % | -4.4 % |
| Riverside, CA | $1,856,035 | 4.4 % | 22.3 % | 27 | 25.0 % | -2.0 % | -15.0 % |
| Detroit, MI | $1,016,345 | 6.0 % | 15.9 % | 6 | -5.4 % | -3.4 % | -24.2 % |
| Seattle, WA | $3,249,761 | 4.3 % | 19.6 % | 11 | 16.6 % | 5.4 % | -25.2 % |
| Minneapolis, MN | $1,323,858 | 3.7 % | 19.9 % | 24 | -11.4 % | -19.0 % | -14.8 % |
| San Diego, CA | $4,160,165 | 0.7 % | 21.6 % | 18 | 20.0 % | 13.0 % | -12.1 % |
| Tampa, FL | $1,772,389 | -1.7 % | 29.2 % | 39 | 2.1 % | 0.9 % | -26.5 % |
| Denver, CO | $2,240,439 | 0.7 % | 25.7 % | 14 | 12.2 % | 6.9 % | -11.0 % |
| Baltimore, MD | $1,464,758 | 3.4 % | 16.0 % | 6 | 0.0 % | -3.0 % | -15.8 % |
| St. Louis, MO | $1,138,663 | 4.2 % | 20.2 % | 7 | -12.8 % | -18.9 % | -22.5 % |
| Orlando, FL | $1,579,477 | 2.1 % | 25.7 % | 25 | 13.2 % | 4.7 % | -9.2 % |
| Charlotte, NC | $1,803,805 | 3.1 % | 22.2 % | 6 | 9.9 % | 7.5 % | -24.6 % |
| San Antonio, TX | $1,297,397 | 1.2 % | 23.2 % | 32 | -0.7 % | 2.9 % | -20.2 % |
| Portland, OR | $1,665,906 | 2.5 % | 18.0 % | 14 | 4.2 % | -1.1 % | -19.7 % |
| Sacramento, CA | $2,169,309 | 1.5 % | 20.6 % | 10 | 3.1 % | 5.8 % | -17.4 % |
| Pittsburgh, PA | $941,406 | 4.8 % | 18.4 % | 7 | -17.1 % | -8.7 % | -2.9 % |
| Cincinnati, OH | $1,057,525 | 7.3 % | 18.7 % | 5 | -19.2 % | -12.6 % | -8.4 % |
| Austin, TX | $2,469,719 | -2.1 % | 22.2 % | 43 | -7.2 % | -8.5 % | -22.9 % |
| Las Vegas, NV | $1,879,567 | 6.1 % | 24.2 % | 30 | 21.5 % | 8.7 % | -17.8 % |
| Kansas City, MO | $1,165,452 | 3.7 % | 25.1 % | 8 | -8.0 % | -18.7 % | -10.8 % |
| Columbus, OH | $1,152,893 | 6.8 % | 22.2 % | 5 | -7.2 % | -12.7 % | -15.2 % |
| Indianapolis, IN | $1,092,050 | 4.1 % | 22.9 % | 6 | 3.6 % | 20.5 % | -3.2 % |
| Cleveland, OH | $902,534 | 6.1 % | 18.3 % | 7 | -1.7 % | 7.7 % | -15.8 % |
| San Jose, CA | $5,923,483 | 4.2 % | 15.9 % | 10 | 23.8 % | 11.1 % | 35.5 % |
| Nashville, TN | $2,397,091 | 4.9 % | 24.9 % | 24 | -10.9 % | -16.7 % | -36.6 % |
| Virginia Beach, VA | $1,365,632 | 3.6 % | 18.1 % | 21 | 15.1 % | -1.4 % | -2.6 % |
| Providence, RI | $2,095,252 | 4.6 % | 11.7 % | 13 | 35.1 % | 66.7 % | 9.8 % |
| Jacksonville, FL | $1,821,428 | 0.1 % | 24.3 % | 41 | -0.1 % | -10.3 % | -6.2 % |
| Milwaukee, WI | $1,312,594 | 4.5 % | 16.0 % | 29 | -13.5 % | -24.8 % | null |
| Oklahoma City, OK | $961,972 | 3.7 % | 22.1 % | 22 | -11.0 % | -19.7 % | 0.7 % |
| Raleigh, NC | $1,743,767 | 4.6 % | 23.0 % | 9 | 8.0 % | -1.4 % | -14.6 % |
| Memphis, TN | $956,117 | 1.9 % | 23.5 % | 13 | -4.2 % | -5.1 % | 8.7 % |
| Richmond, VA | $1,285,624 | 5.5 % | 15.1 % | 7 | 9.3 % | -2.0 % | -4.0 % |
| Louisville, KY | $915,074 | 3.9 % | 21.3 % | 12 | -5.2 % | -9.2 % | -29.8 % |
| New Orleans, LA | $1,230,067 | 2.1 % | 20.4 % | 43 | -15.2 % | -22.2 % | -2.8 % |
| Salt Lake City, UT | $1,809,781 | 4.5 % | 19.4 % | 12 | -1.9 % | 7.5 % | 3.7 % |
| Hartford, CT | $1,103,839 | 5.5 % | 10.5 % | 5 | 5.0 % | 3.1 % | 3.0 % |
| Buffalo, NY | $835,064 | 5.7 % | 13.6 % | 15 | -19.2 % | -4.2 % | 9.3 % |
| Birmingham, AL | $1,310,696 | 5.0 % | 20.2 % | 7 | -11.7 % | -18.9 % | -26.7 % |
– more at azbigmedia.com
Thinking about investing in Phoenix real estate? Have a property to sell in Arizona? Tell us what you’re searching for. Connect with us to buy, sell, or lease multifamily, residential and commercial real estate in Phoenix, and across Arizona. Let’s work together.
Natan Jacobs, Vestis Group
Call: 602-281-6202
Email: Info@Vestis-Group.com